Coin Watch: Ethereum (ETH)
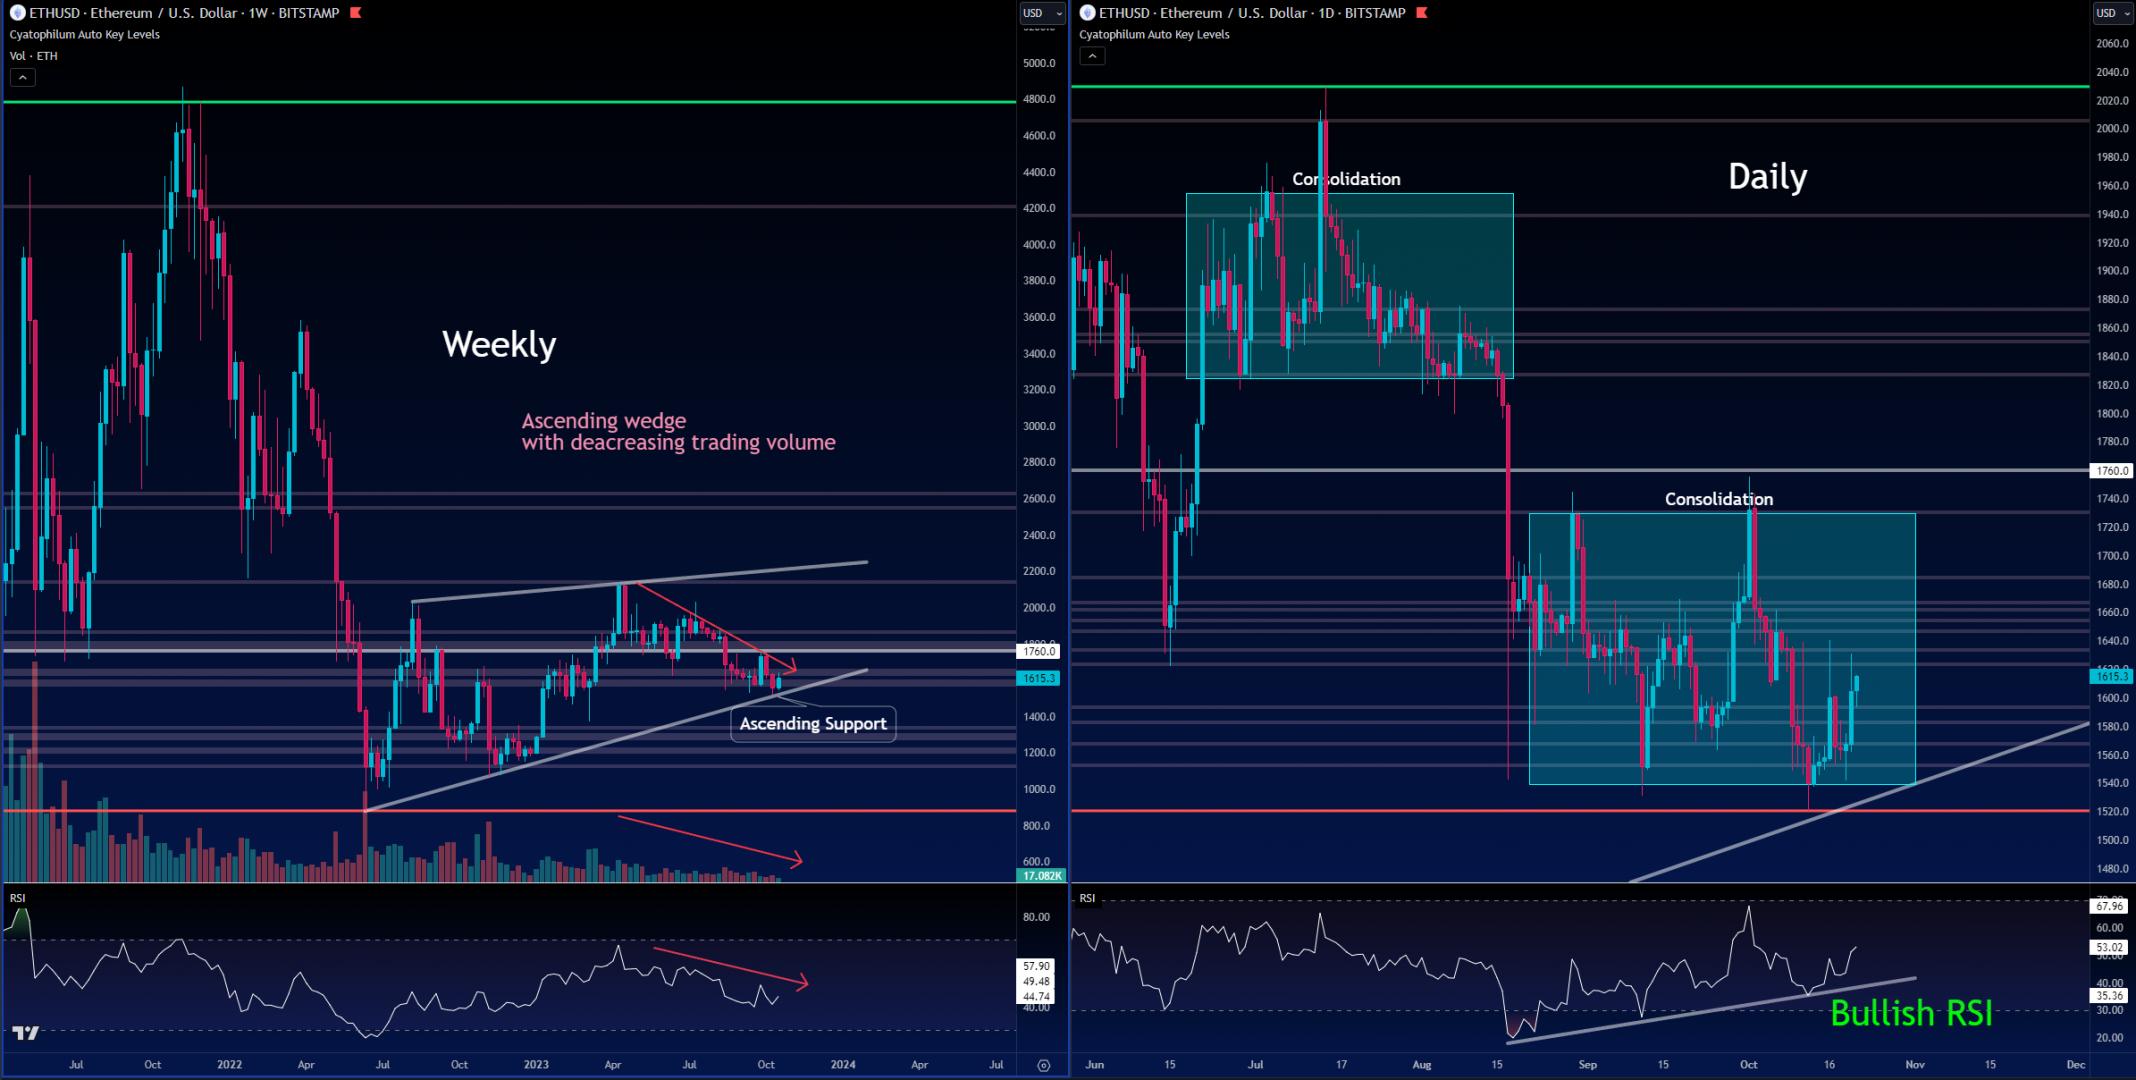
The weekly shows an ascending wedge.
A rising wedge is often considered a bearish chart pattern that indicates a potential breakout to the downside.
Trading volume and RSI are also decreasing.
=> The sentiment is bearish on the weekly timeframe.
On the daily, we are seeing consolidation areas. The current area might be broken to either side, knowing the previous one broke down. It's important to remember that we are at the support level of the rising wedge on the weekly chart, so we could bounce off it, or break it down.
The RSI is rising however and making higher lows which is a bullish sign.
Moving on to the 4 hours chart:
We basically zoomed in that consolidation area. The market is clearly ranging, meaning people are buying at support areas and selling at resistances.
The RSI is also ranging but showing a bullish divergence although already being in overbought areas.
Another chart I think is important to look at when analysing Ethereum is the ETH/BTC one.
The weekly chart clearly shows us that BTC is gaining power against ETH through the year and is showing no sign of stopping! That, to me, is a strong bearish signal for ETH.
Stay tuned!
Written by Cyatophilum - Created 3 years ago - Last edited 3 years ago
Recent Articles
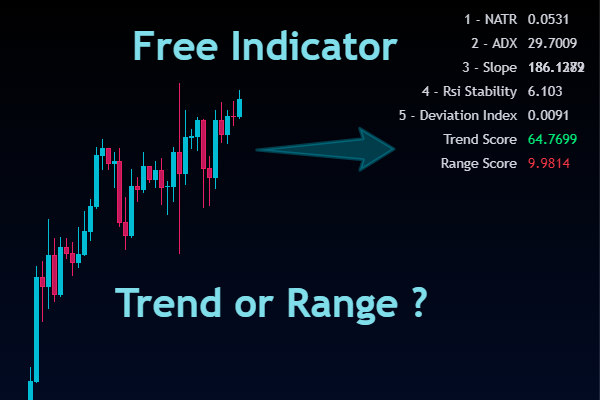
Introducing the "Trend or Range?" Indicator
Understanding market conditions is a cornerstone of successful trading. Whether you’re trading cryptocurrencies, stocks, or forex, identifying if a market is trending or range-bound can drastically enhance your strategy’s effectiveness. The "Trend or Range?" indicator is here to simplify this process.
What Is the "Trend or Range?" I ...
We are thrilled to announce that short bots are now available!
In this article, we will see why a short bot could be interesting, how it works, and how to trade safely.
Why use a short bot?
Just like a buy and sell bot, the idea of a short bot is to make a profit out of price action, but in a bear market.
For a buy and sell bot, we just need a simple spot trading wallet, ...

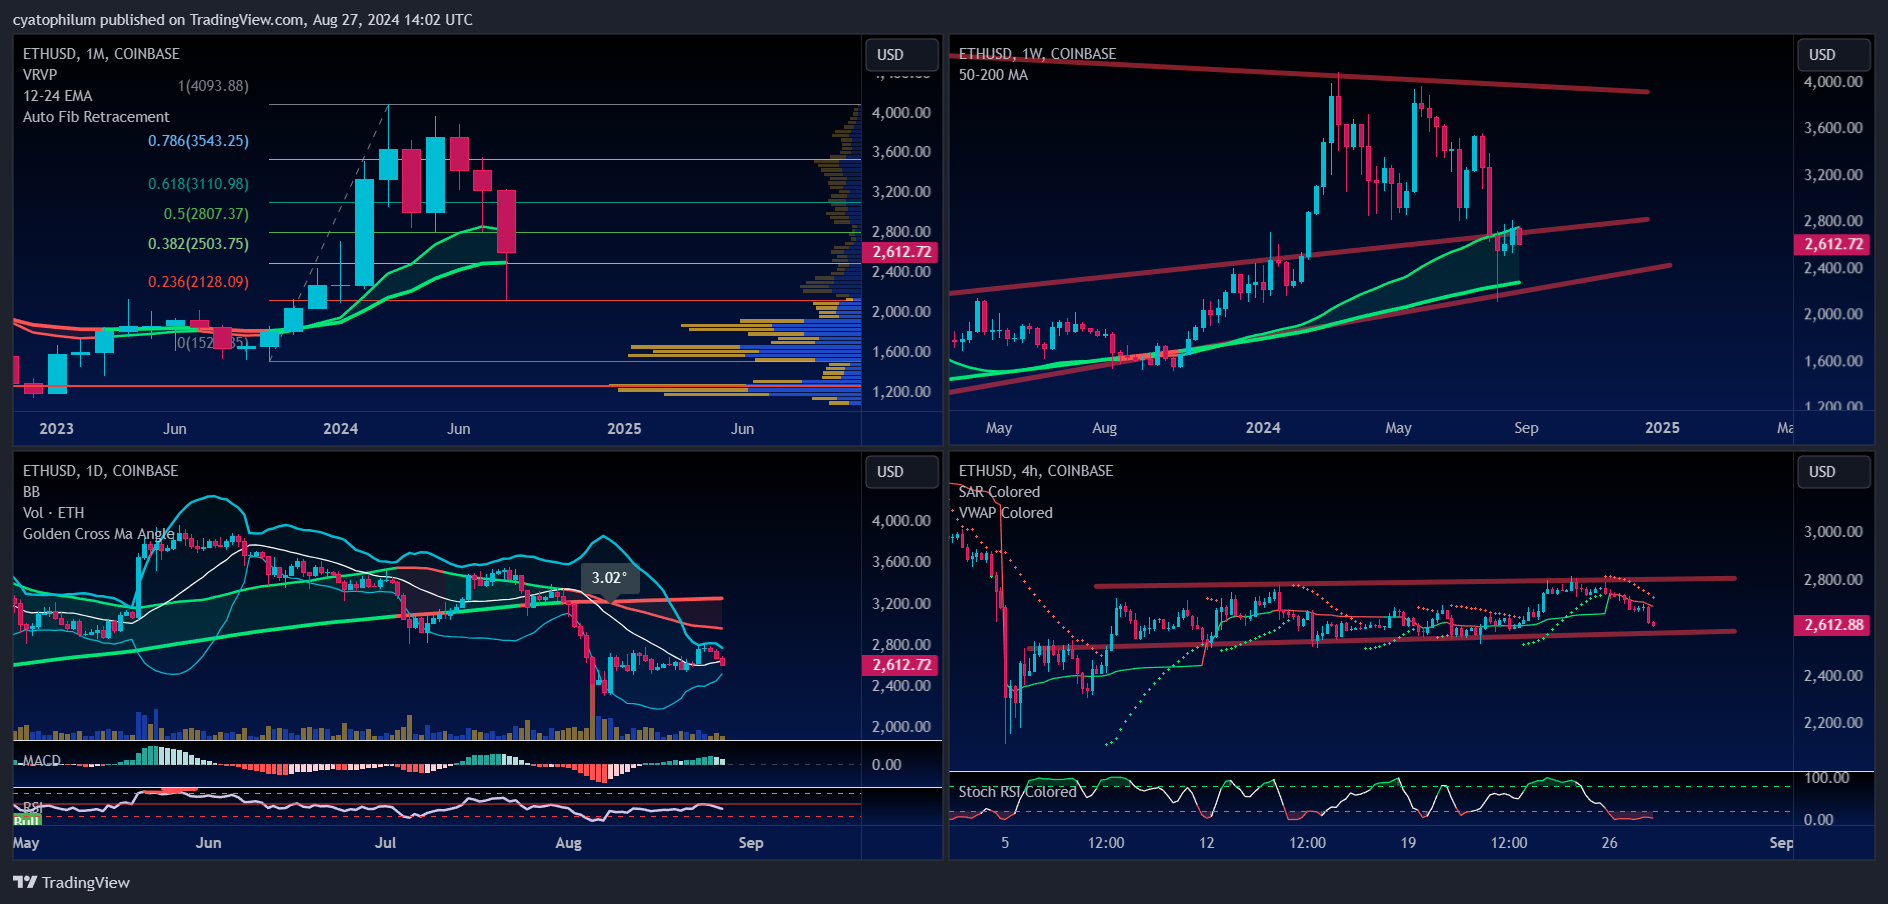
Ethereum is now trading at $2600 and this month saw a lot of volatility but mainly bearish as the price went from above the $3000 level down to the exact 0.236 Fibonacci level at $2130.
The August monthly candle is printing a long lower shadow and the close above or below the 24 months EMA will be crucial to indicate a global trend. It will be 3 bearish candles in a row, which has been the maxi ...
Welcome to our weekly analysis of the cryptocurrency space.
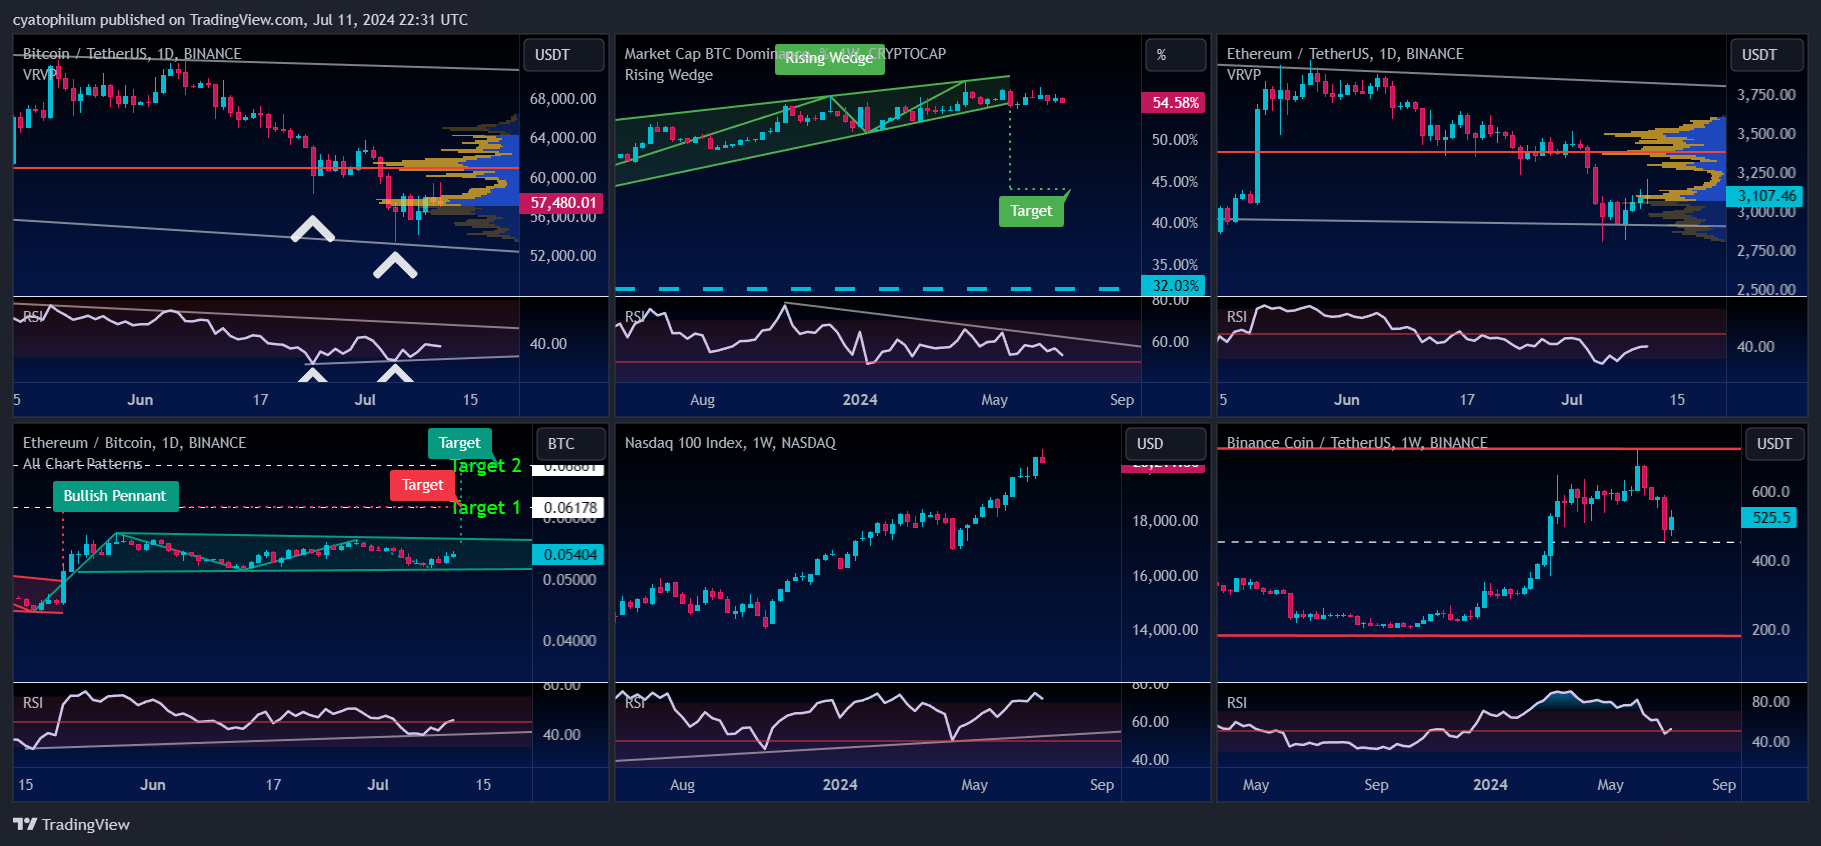
BTC/USDT
The BTCUSDT chart shows Bitcoin trading within a descending channel, with recent price action bouncing off the lower boundary of this channel, indicating potential support around the $53,000 level. The RSI indicates bullish divergence, suggesting a possible trend reversal or a strong bounce from this support level ...